 If 120 seats are arranged in a row (that is one really long row!),
what is the least number of
seats that must be occupied so the next person seated must sit next to
someone?
If 120 seats are arranged in a row (that is one really long row!),
what is the least number of
seats that must be occupied so the next person seated must sit next to
someone?

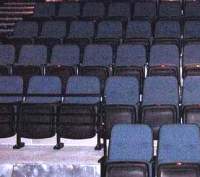
It will definitely help to make a diagram like the one above, where the
blue
shapes represent occupied seats in the L-O-N-G row of 120 seats, and the
red
shapes represent unoccupied seats. (Of course, in that diagram, someone
could still sit down in one of the red unoccupied seats and not be right
next to anyone already in a blue seat).
You'll also find it useful to use the strategies of simplifying the
problem (try a
shorter row first) and looking for patterns.
As always, be sure to explain the
work you did to arrive
at your answers!