CHAPTER 3 - Random Variables and Distributions
Section 3.1, page 102
Problem 2
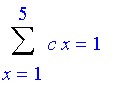
We must have
| > | Sum(c*x,x=1..5)=1; |
| > | solve(%,c); |
| > | value(%); |
![]()
So the probability distribution is P(x)=x/15.
Problem 8
This is about the binomial distribution. With Maple, we can do it the hard way:
| > | sum(binomial(20,k)*(1/10)^k*(9/10)^(20-k),k=4..20); |
| > | evalf(%); |
![]()
The probability is a little more than 13% that more than three of the balls will be red.
Section 3.2, page 109
Problem 4
First, the constant c:
| > | solve(int(c*x^2,x=1..2)=1,c); |
![]()
Now the sketch:
| > | plot(3/7*x^2,x=1..2,color=blue,thickness=2,view=[0..3,0..2]); |
![[Maple Plot]](images/m115-ex37.gif)
Part (b) requires:
| > | int(3/7*x^2,x=3/2..2); |
![]()
Problem 8
This is like problem 4:
| > | solve(int(c*exp(-2*x),x=0..infinity)=1,c); |
![]()
| > | plot(2*exp(-2*x),x=0..6,color=blue,thickness=2); |
![[Maple Plot]](images/m115-ex310.gif)
| > | int(2*exp(-2*x),x=1..2); |
![]()
| > | evalf(%); |
![]()
So the probability that we will find X between 1 and 2 is about 11.7 %
Section 3.3, page 116
Problem 8
We start with the cumulative distribution function of Z. First, note that the pdf on the disk is uniform with a value of ![]() , since the area of the whole disk is
, since the area of the whole disk is ![]() . So the probability that a point is within r units from the origin is
. So the probability that a point is within r units from the origin is  , or simply
 ![]() . Since the pdf of the distribution of Z is simply the derivative of its cumulative distribution, we have that the df of Z is 2r. Here's a sketch:
. Since the pdf of the distribution of Z is simply the derivative of its cumulative distribution, we have that the df of Z is 2r. Here's a sketch:
| > | plot(2*r,r=0..1,color=blue,thickness=2); |
![[Maple Plot]](images/m115-ex317.gif)